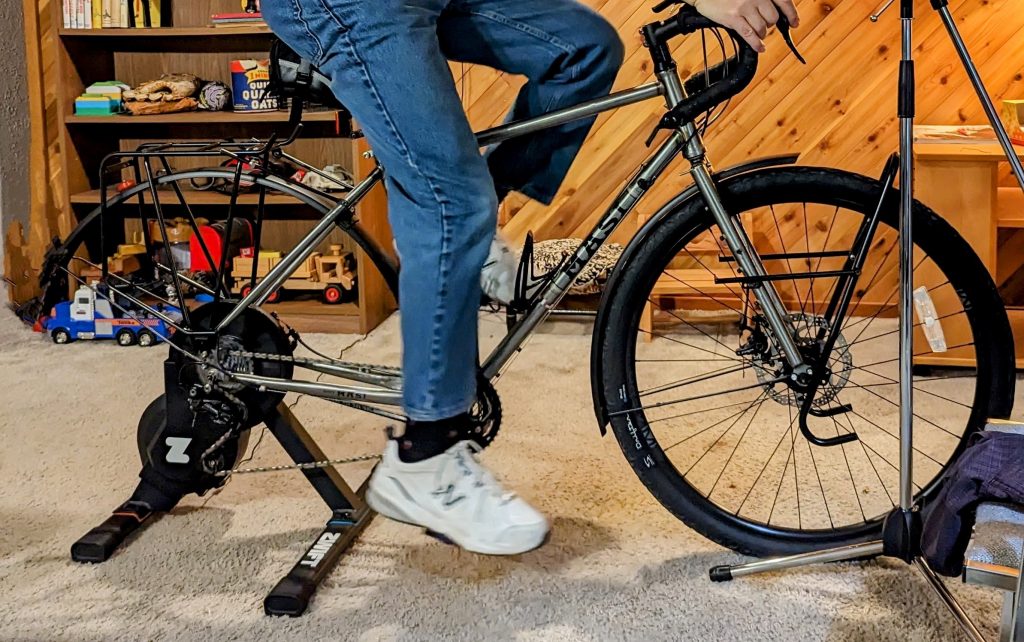
I am cycling through data nerd heaven. Winter weather “forced” me to buy a Zwift Hub indoor bike trainer so that I could ride in icy, wet weather that normally keep me out of the saddle. The trainer tells me how much power I am pumping through the pedals, info that I have never had before. I then added a Velocomp PowerPod power meter to my bicycle so that I could know my power output when riding outside, too.
I bought the Zwift Hub when I found a $50 off “coupon” for it on Strava. I set it up in the basement with the Zwift “game” running on my old iPad. I connected the iPad to an old TV so that I could have a nice virtual world to ride through. Between the game and podcasts and tunes, I am actually not bored when riding in the basement, a pleasant surprise.
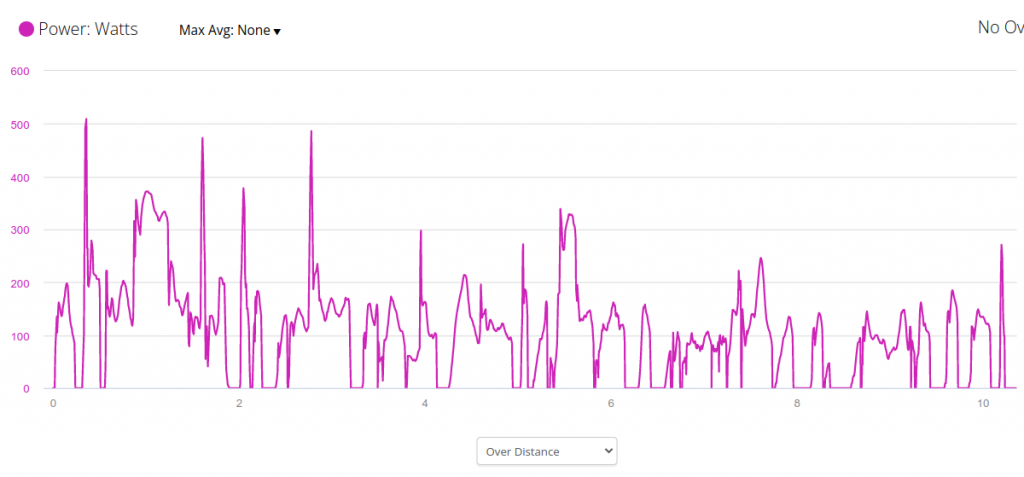
When riding on my Zwift Hub trainer, I get power graphs. In this particular ride, I was on a flat course through the virtual world of Watopia and just cruising around enjoying the scenery.
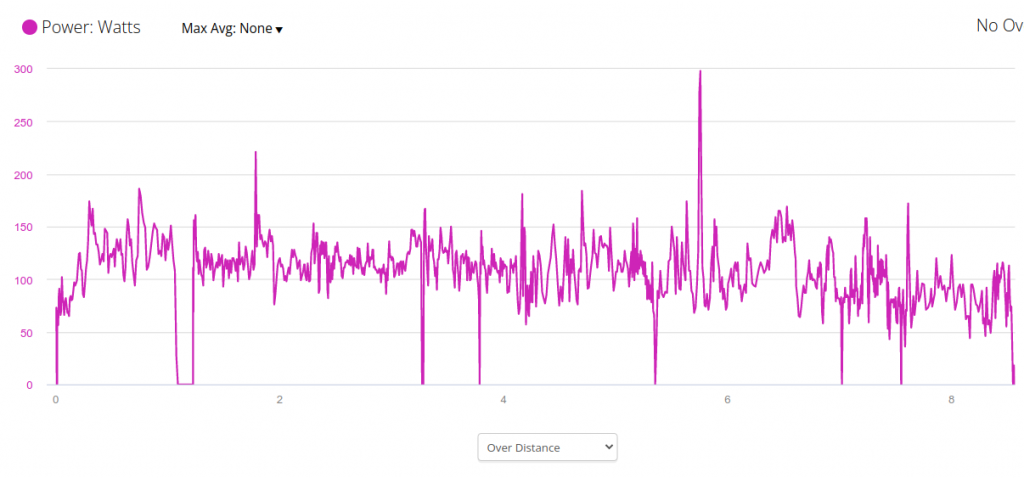
The graph is squiggly but still clearly shows that my power is generally around 110 Watts. At this level, you probably won’t see me in the Tour de France.
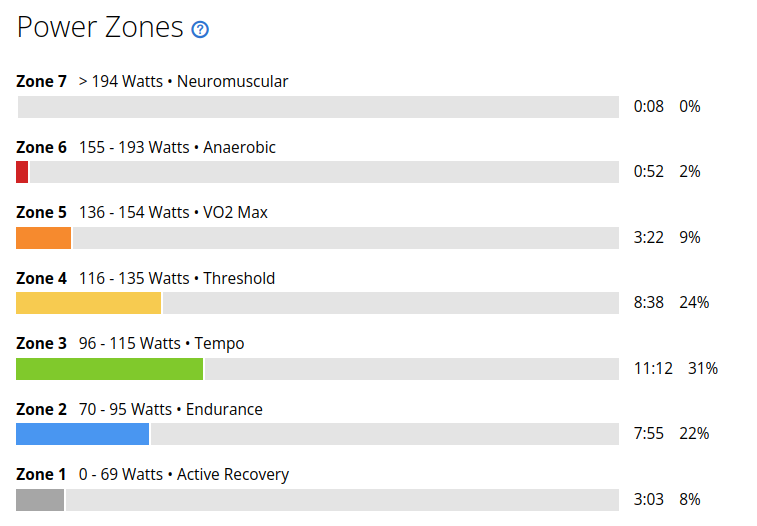
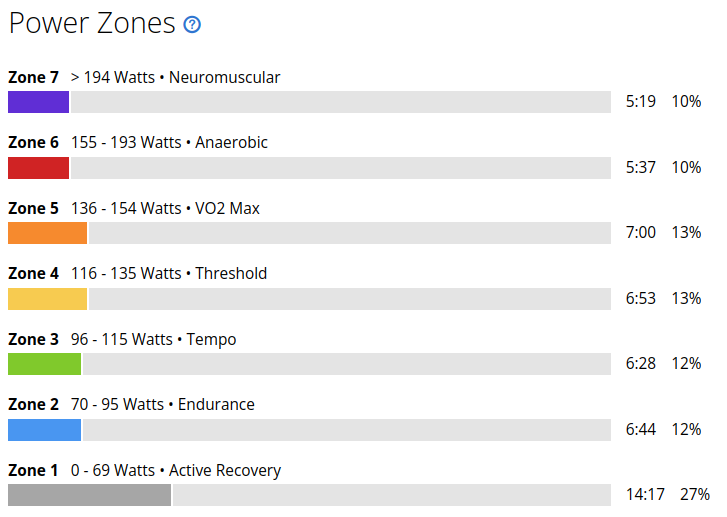
Zwift has a 20 minute FTP test. I did that and entered my FTP into my Garmin watch. Knowing my FTP let the watch set power zones for me. With the power zones, Garmin produces bar charts like this.
I was hooked. I wanted the same data when riding outside, not only when riding in the basement. I started researching bike power meters. Most of them are strain gauges installed in one or both of the cranks. Some are in the pedals. I even found one DIY power meter that works by installing strain gauges inside the axle between the cranks. Generally speaking, these DFPMs all work by measuring how much you bend the crank arm or the pedal or twist the axle when are pushing down with your foot. From that measurement, the electronics calculate the power that you are generating with your legs. Cost is the biggest downside to DFPMs. They start at about $700, which is kind of a lot since I am not in a serious training regimine.
Then I found something with some serious engineering chops: the Velocomp PowerPod. It works by measuring (or estimating) the on-the-road data acting on the bike: speed, hill slope, bicycle acceleration, wind speed, and friction (estimated from weight and road surface). Using those data and Newton’s laws of physics, the PowerPod calculates the power generated by your legs. Amazingly, it works really well, with PowerPod returning results which are highly consistent from one ride to the next, and within about 2% of a DFPM. Even better, I found the PowerPod on sale for $269 at Power Meter City.
(As an aside, Power Meter City’s presales support was amazingly good. I highly recommend this store and they didn’t even pay me to write that.)
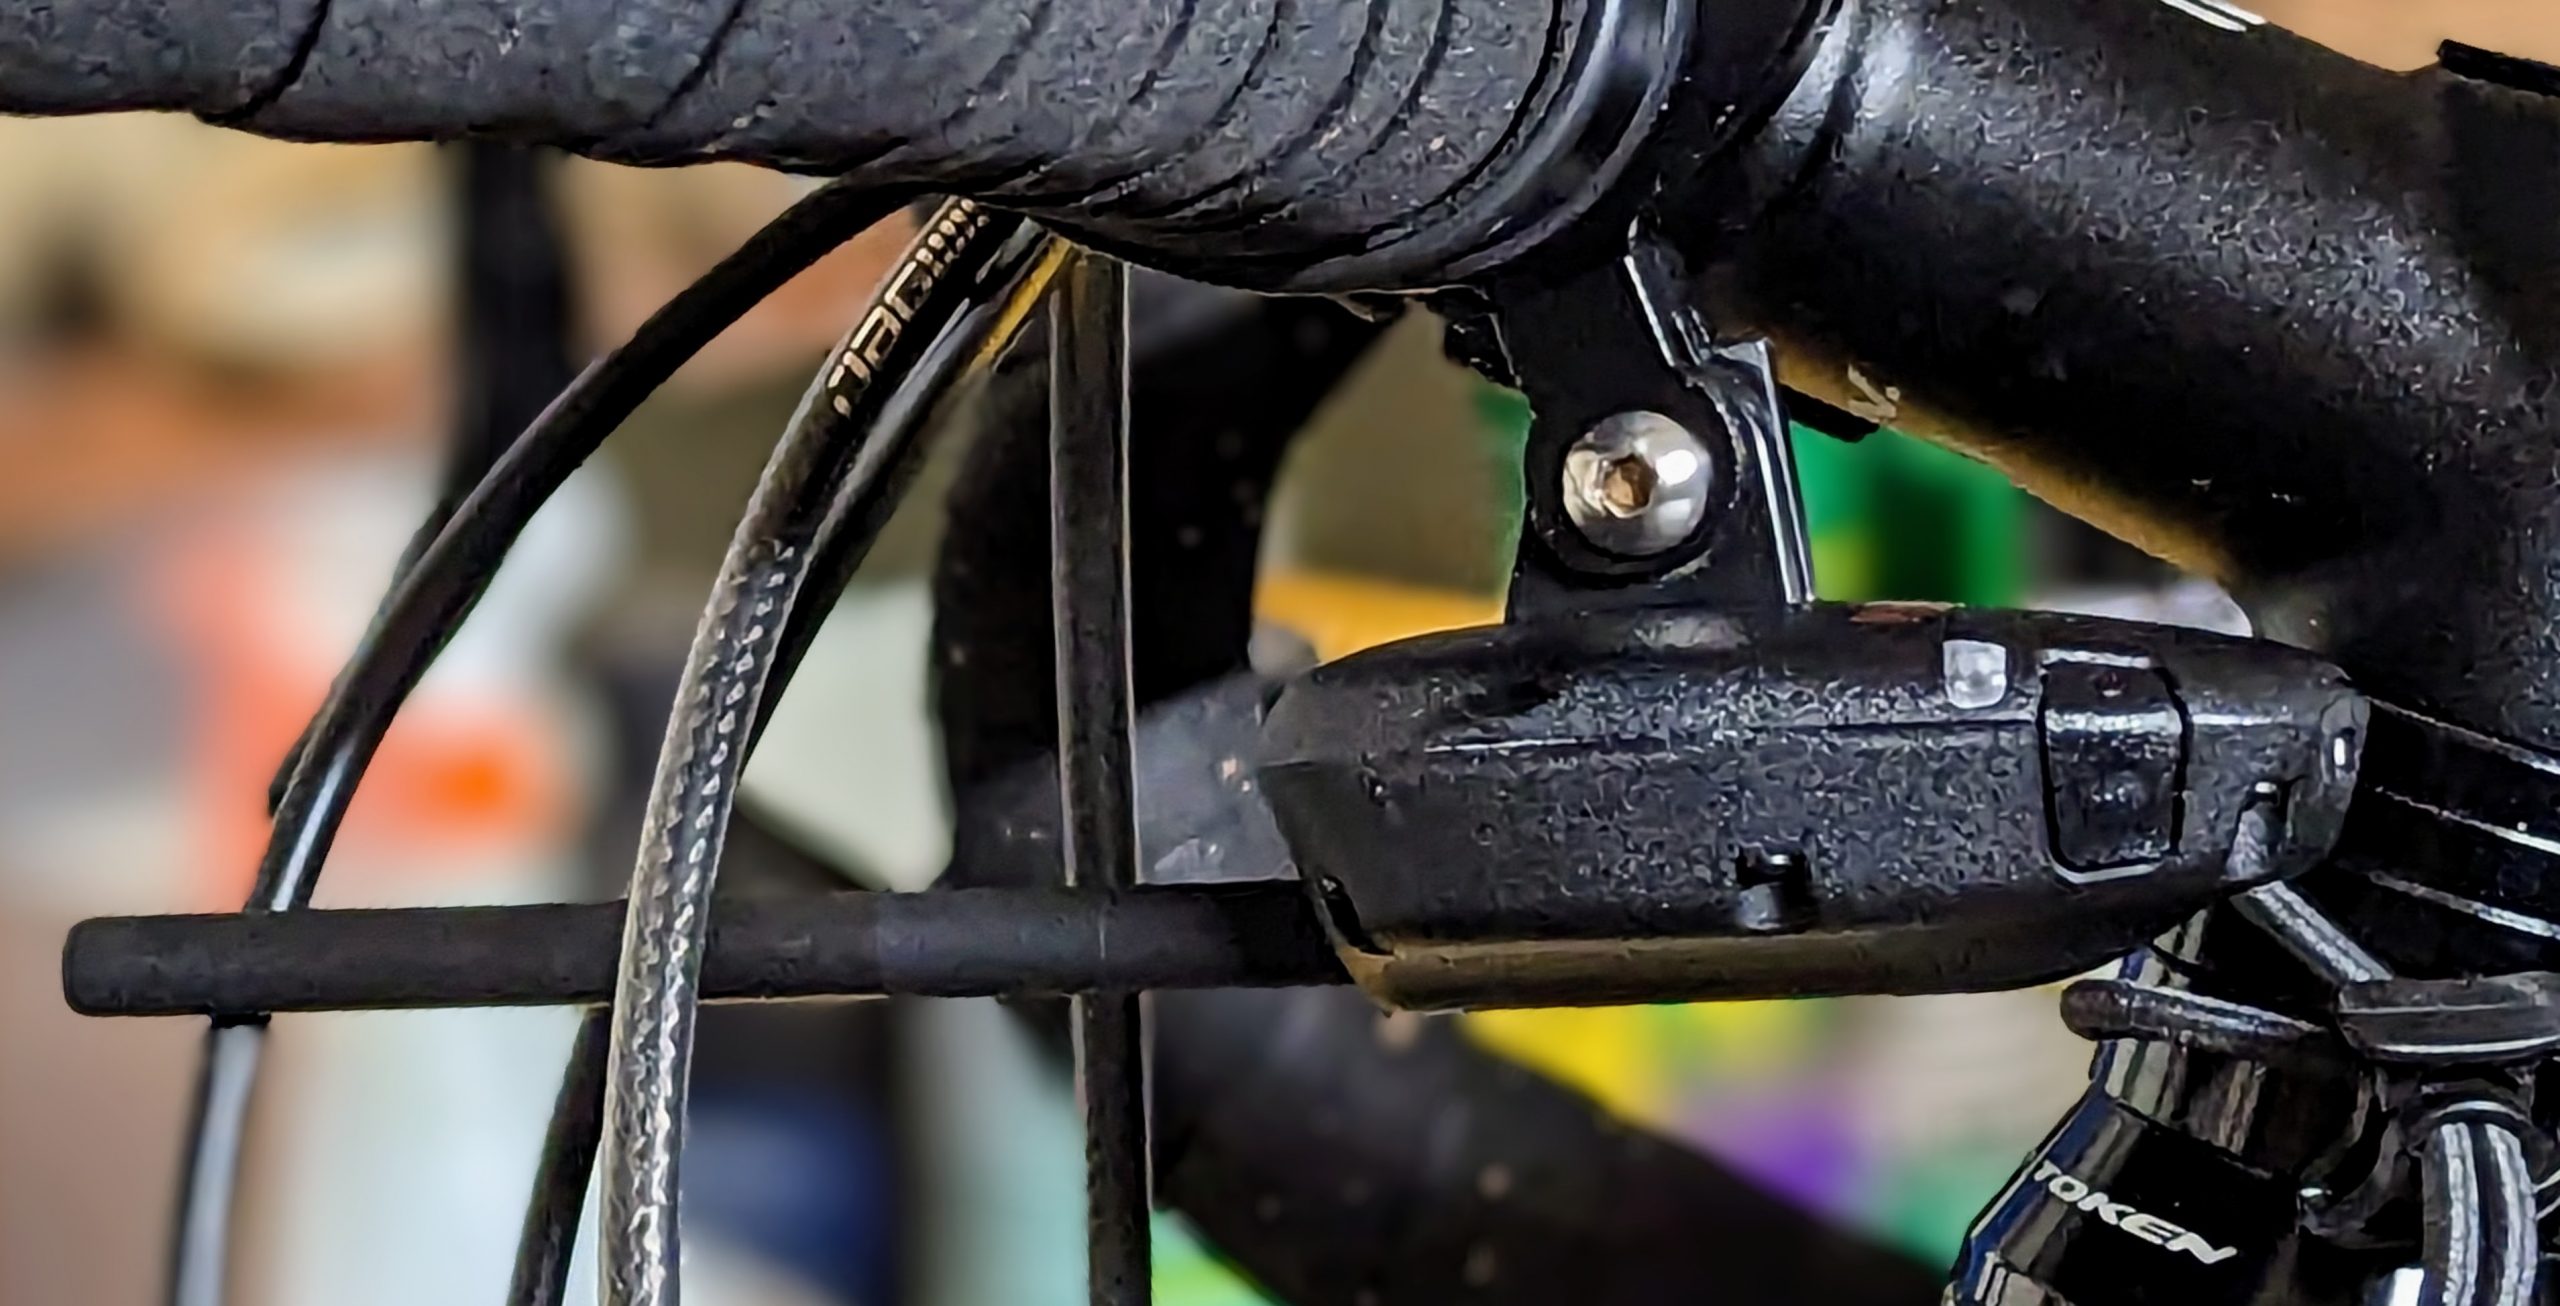
I paired the PowerPod with my Garmin watch and with RideWithGPS on my phone. This worked because it broadcasts using both ANT+ for the watch and BLE for the phone. It was time to ride.
Afterwards, Garmin generated graphs similar to what I showed above. Here are the graphs for a hilly 10 mile ride that I took this afternoon.
Unlike the virtual ride, these graphs are pretty but nowhere near as useful. Because of the hills, traffic, and the need to actually stop at many intersections, my power is all over the map, pretty evenly split across six of the seven zones. This is where the Isaac software, provided free with the PowerPod, really shines, providing a highly detailed analysis. (You can click on this image to see it larger.)
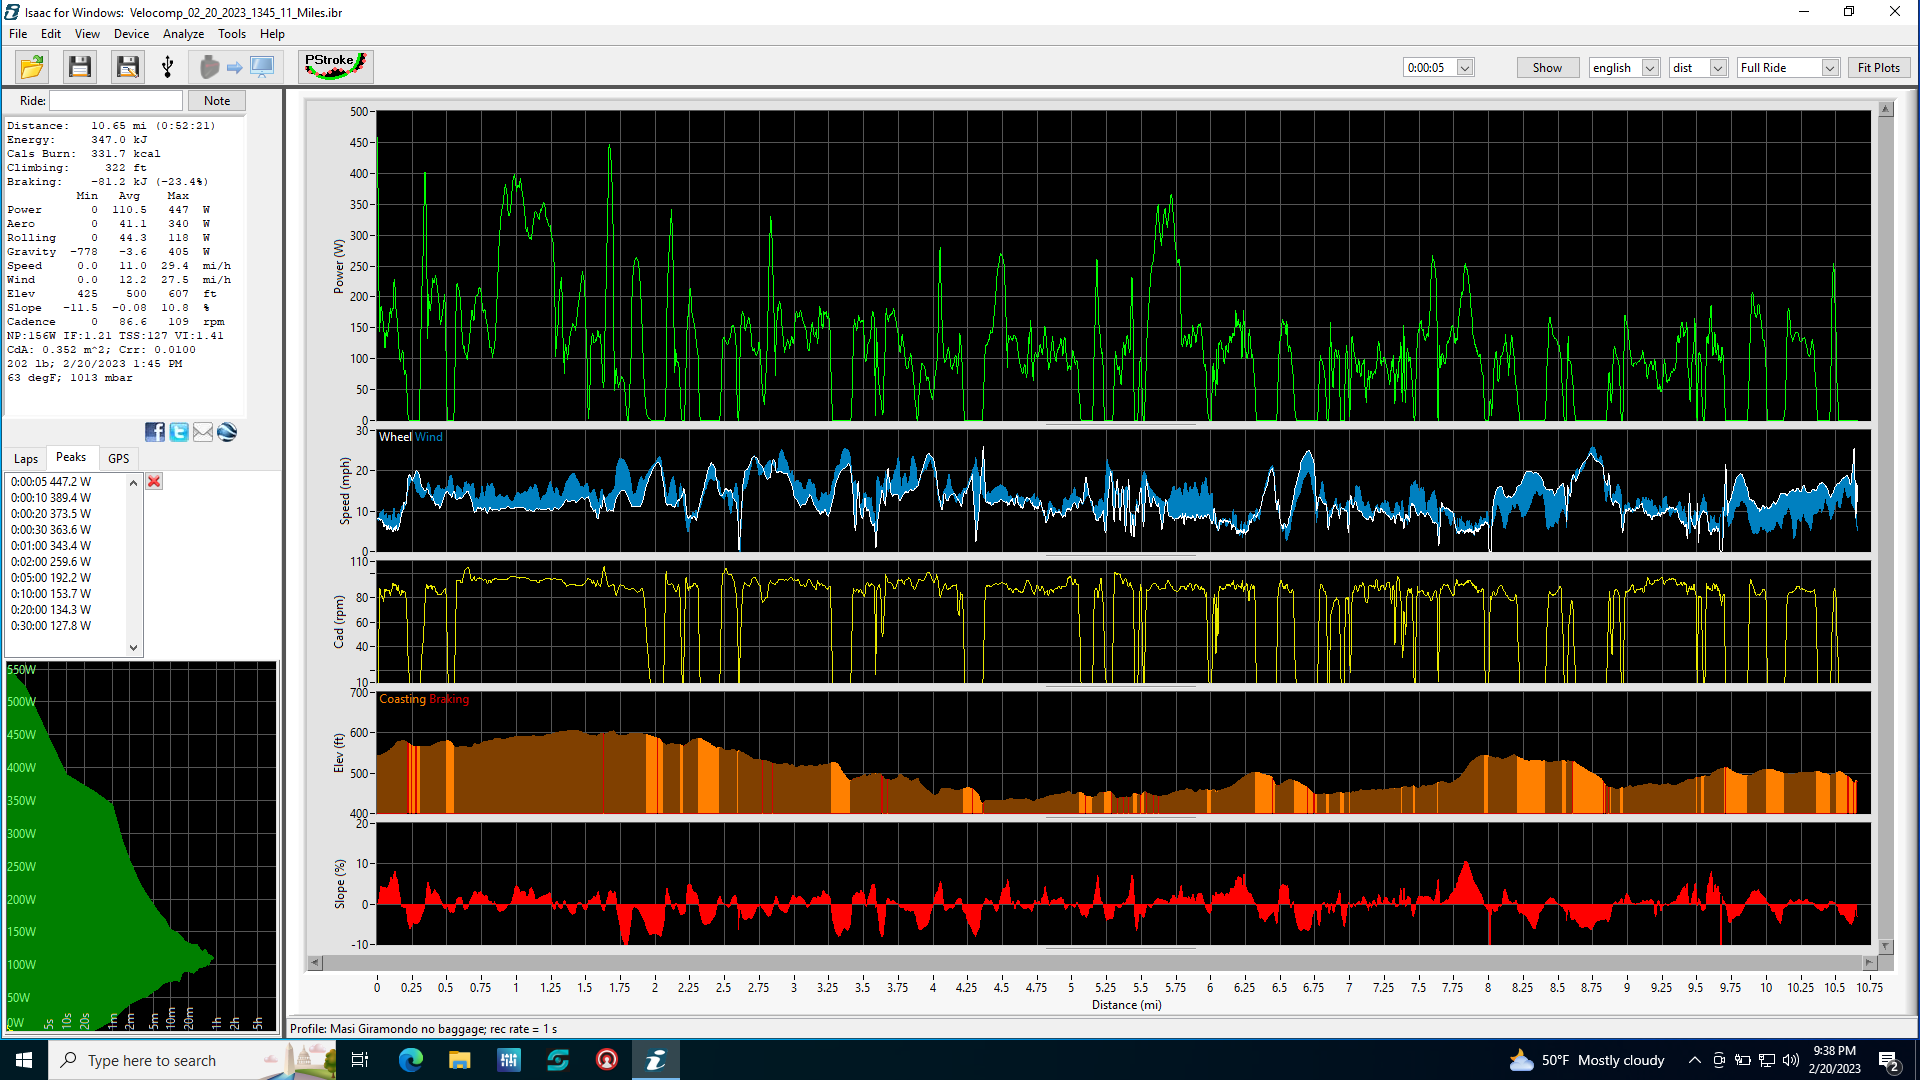
The top, left corner gives some summary data:
Distance:     10.65 mi (0:52:21)
Energy:       347.0 kJ
Cals Burn:    331.7 kcal
Climbing:     322 ft
Braking:      -81.2 kJ (-23.4%)

            Min     Avg     Max
Power         0     110.5   447 W
Aero          0      41.1   340 W
Rolling       0      44.3   118 W
Gravity    -778      -3.6   405 W
Speed       0.0      11.0  29.4 mi/h
Wind        0.0      12.2  27.5 mi/h
Elev        425       500   607 ft
Slope     -11.5     -0.08  10.8 %
Cadence       0      86.6   109 rpm

NP:156W IF:1.21 TSS:127 VI:1.41
CdA: 0.352 m^2; Crr: 0.0100
202 lb; 2/20/2023 1:45 PM
63 degF; 1013 mbar
The PowerPod reports how much of my power (110 Watts, on average) was spent fighting the wind (aero: 41 W), overcoming friction in the drivetrain (rolling: 44 W), and climbing hills (gravity: -3.6 W because this ride was slightly downhill). It also tells me how much of the energy I put into pedaling was wasted in braking (23.4%). On average, I bucked a 12.2 MPH headwind.
The graphs are even better. The green line is power. The white line shows my speed with the blue areas showing wind, relative to the bicycle. When the blue is above the white line, it is a headwind.
The brown/orange curve with occasional red lines shows elevation. Brown means I was pedaling. Orange means that I was coasting. Red means that I was braking.
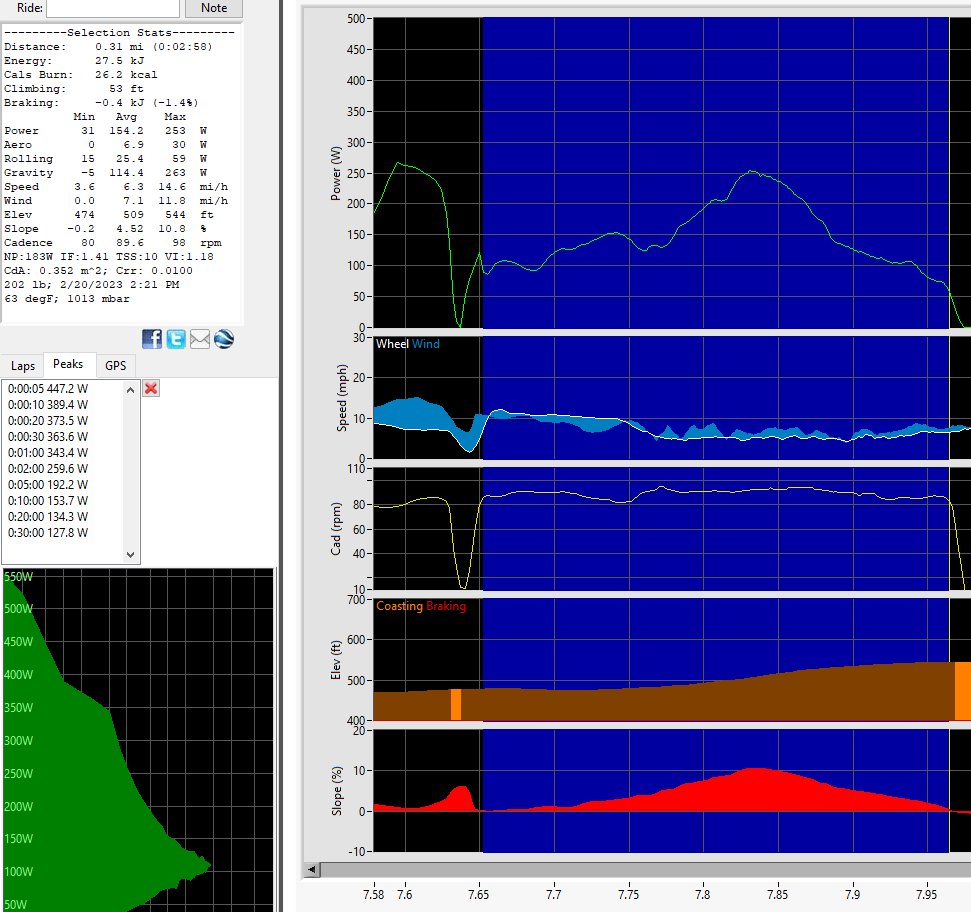
I can even highlight a section of the ride and zoom in to see an analysis of just that portion. Here is my effort climbing a short hill. (You can click on this image to see it larger.)
---------Selection Stats---------
Distance:    0.31 mi (0:02:58)
Energy:      27.5 kJ
Cals Burn:   26.2 kcal
Climbing:      53 ft
Braking:     -0.4 kJ (-1.4%)
         Min    Avg    Max
Power     31  154.2    253 W
Aero       0    6.9     30 W
Rolling   15   25.4     59 W
Gravity   -5  114.4    263 W
Speed    3.6    6.3   14.6 mi/h
Wind     0.0    7.1   11.8 mi/h
Elev     474    509    544 ft
Slope   -0.2   4.52   10.8 %
No, I don’t know why my max power on the gravity line is higher than my max power on the overall Power line.
I am planning to bike from my home to Minneapolis in May. It will be interesting to see whether my power improves as I do more riding, both indoors on my Zwift Hub and outdoors as the weather improves.
