On May 12, I took my Bede BD-4C airplane up for another test flight to refine the stall speeds. I had previously determined that the slowest stall speed, with the flaps fully extended, was 61 knots. That seemed too fast and I wanted to recheck it.
Here is the overview graph of airspeed and vertical speed. From the airspeed, you will see that this is actually two flights. I took off, landed at about six minutes, took off again at about nine minutes, had a longer flight, and landed at about 41 minutes. (You can click on any graph to see it larger.)
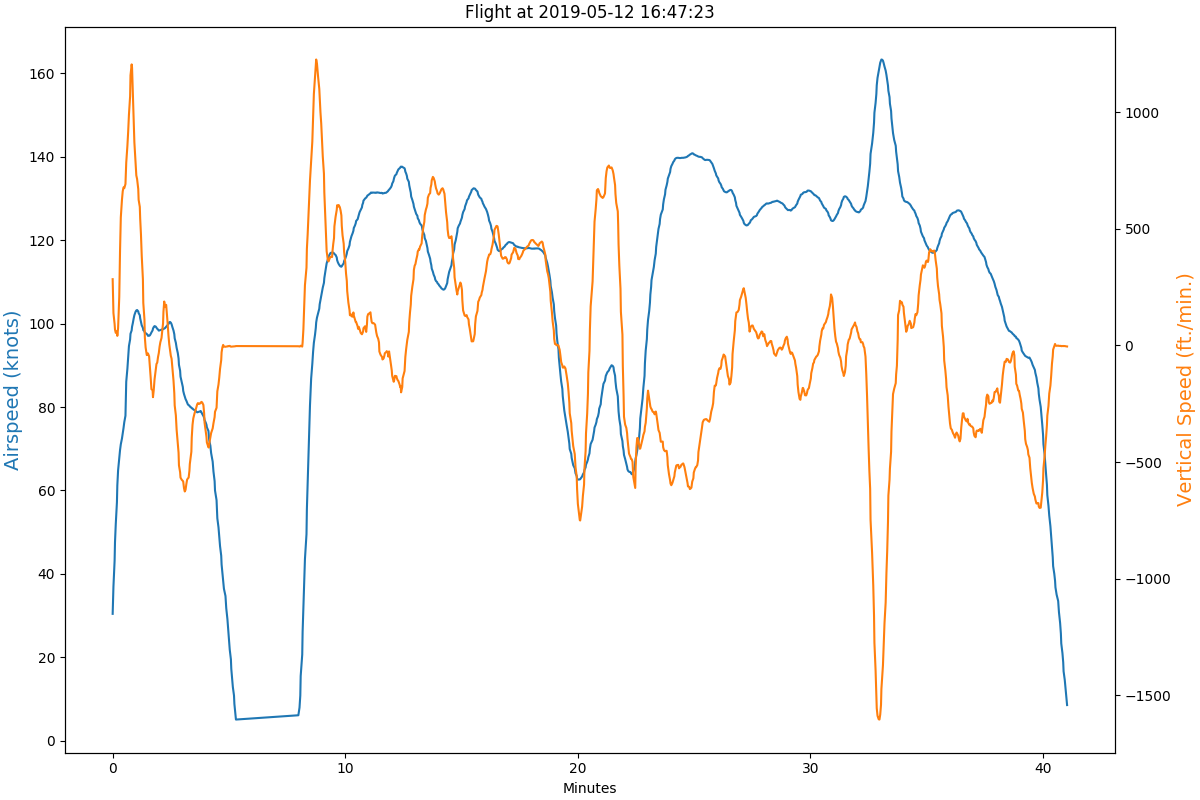
I want to focus on the two stall tests that I performed. You see those in the above graph where the airspeed hits low values at about 20 and 22 minutes. Here is a zoomed in graph, showing just that portion of the flight.
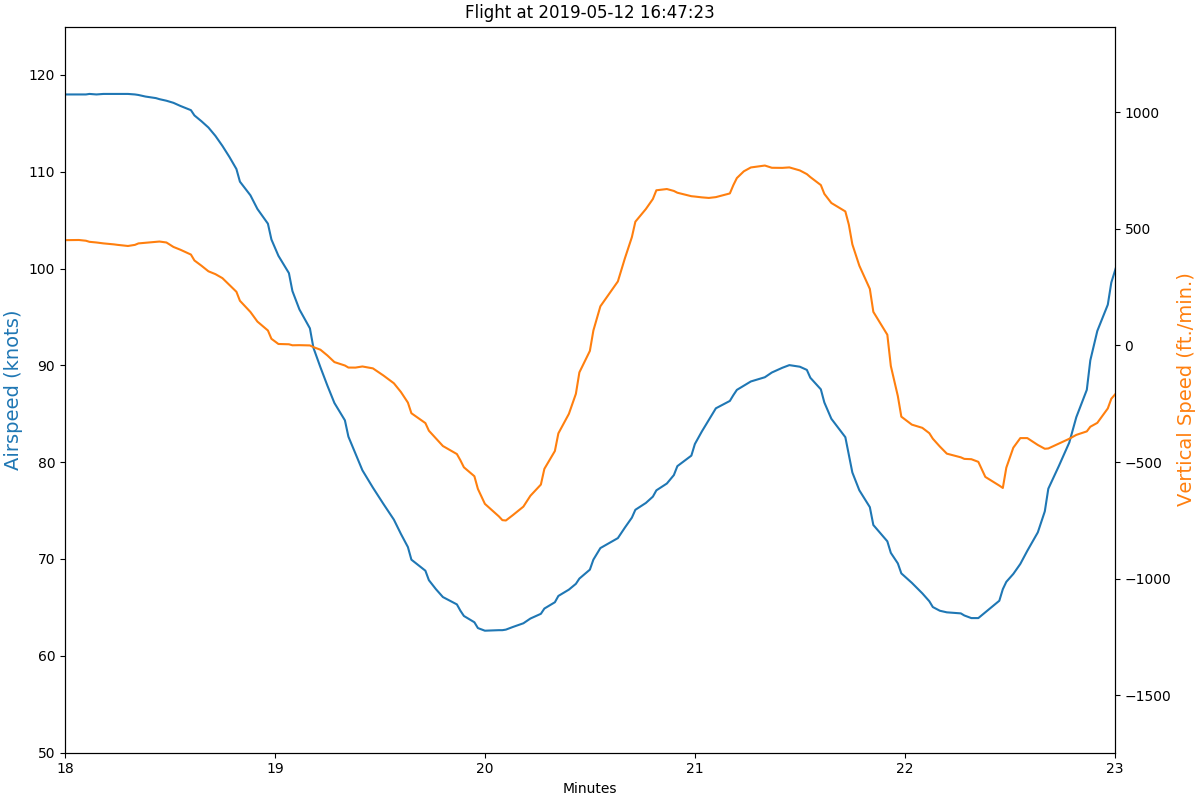
If you look carefully at that graph, you will see that the minimum airspeed, the stall speed, occurs at 20 minutes and is about 60 or 61 knots. It is exactly what I measured in my previous stall tests and definitely not the lower value that I had hoped to see. Even worse, I remembered seeing speeds in the high 50s on the airspeed indicator in the airplane, while I was flying the tests, which does not agree with the graph.
I was puzzled until I remembered something that I had configured into my plotting software almost two months ago. I had added a rolling average (a/k/a a moving average) to make the lines smoother and the graphs prettier.
Rolling Averages
A friend, who is pretty technical, asked me, “A rolling what?” so I figured that I ought to recap rolling averages. Here is a subset of the data for the airspeed from my test flight. You will see that the data ranges from 21.5 minutes to 21.78 minutes.
The second column gives the raw airspeed at that specific instant in time. For instance,
- at 21.5 minutes, the airplane was going 86.02 knots
- at 21.53 minutes, the airplane was going 81.64 knots
- etc.
The last column gives airspeed with rolling average that is 4 samples wide. I.e., each value is the average airspeed at the specific instant in time and the three previous data points. For instance,
- before 21.6 minutes, there is no calculated airspeed because there are not four values
- at 21.6 minutes, the calculated airspeed is the average of 74.73 and 79.91 and 81.64 and 86.02, which works out to 80.57
- at 21.62 minutes, the calculated airspeed is the average of 70.36 and 74.73 and 79.91 and 81.64, which works out to 76.66
- etc.
| Minutes | Airspeed | Airspeed with Rolling Average |
| 21.5 | 86.0151187904968 | |
| 21.5333333333333 | 81.6414686825054 | |
| 21.55 | 79.9136069114471 | |
| 21.6 | 74.7300215982722 | 80.5750539956803 |
| 21.6166666666667 | 70.3563714902808 | 76.6603671706264 |
| 21.65 | 69.4924406047516 | 73.6231101511879 |
| 21.7166666666667 | 65.1727861771058 | 69.9379049676026 |
| 21.7333333333333 | 64.2548596112311 | 67.3191144708424 |
| 21.75 | 63.3909287257019 | 65.5777537796976 |
| 21.7833333333333 | 62.5269978401728 | 63.8363930885529 |
You will see that the airspeed with a rolling average changes more slowly that the raw airspeed. It also hides the highest and lowest values.
That chart uses a 4-sample window to make the illustration easier to understand. I had actually applied a 16-sample rolling window to my graphs. Here is a chunk of data with a rolling average on a 16-sample window.
| Minutes | Airspeed | Airspeed with Rolling Average |
| 21.5 | 86.0151187904968 | |
| 21.5333333333333 | 81.6414686825054 | |
| 21.55 | 79.9136069114471 | |
| 21.6 | 74.7300215982722 | |
| 21.6166666666667 | 70.3563714902808 | |
| 21.65 | 69.4924406047516 | |
| 21.7166666666667 | 65.1727861771058 | |
| 21.7333333333333 | 64.2548596112311 | |
| 21.75 | 63.3909287257019 | |
| 21.7833333333333 | 62.5269978401728 | |
| 21.8333333333333 | 60.7991360691145 | |
| 21.85 | 59.0712742980562 | |
| 21.9166666666667 | 57.3434125269978 | |
| 21.9333333333333 | 66.036717062635 | |
| 21.9666666666667 | 70.3563714902808 | |
| 21.9833333333333 | 70.3563714902808 | 68.8411177105831 |
| 22.0333333333333 | 69.4924406047516 | 67.8084503239741 |
| 22.0833333333333 | 66.036717062635 | 66.8331533477322 |
| 22.1166666666667 | 62.5269978401728 | 65.7464902807775 |
| 22.1333333333333 | 62.5269978401728 | 64.9838012958963 |
| 22.1666666666667 | 63.3909287257019 | 64.5484611231102 |
| 22.2 | 64.2548596112311 | 64.2211123110151 |
| 22.2666666666667 | 64.2548596112311 | 64.163741900648 |
| 22.2833333333333 | 60.7991360691145 | 63.9477591792657 |
| 22.3166666666667 | 60.7991360691145 | 63.7857721382289 |
| 22.35 | 59.0712742980562 | 63.5697894168466 |
| 22.3833333333333 | 66.9006479481642 | 63.9511339092873 |
Look at the third column and you will see a minimum airspeed of 63.57 knots at 22.35 minute. But look at the second column, the raw airspeed, and you will see a minimum airspeed that is six knots slower: 57.34 knots at 21.92 minutes.
Regraphing without the Rolling Average
When I plot the data without the rolling average, it looks like this.
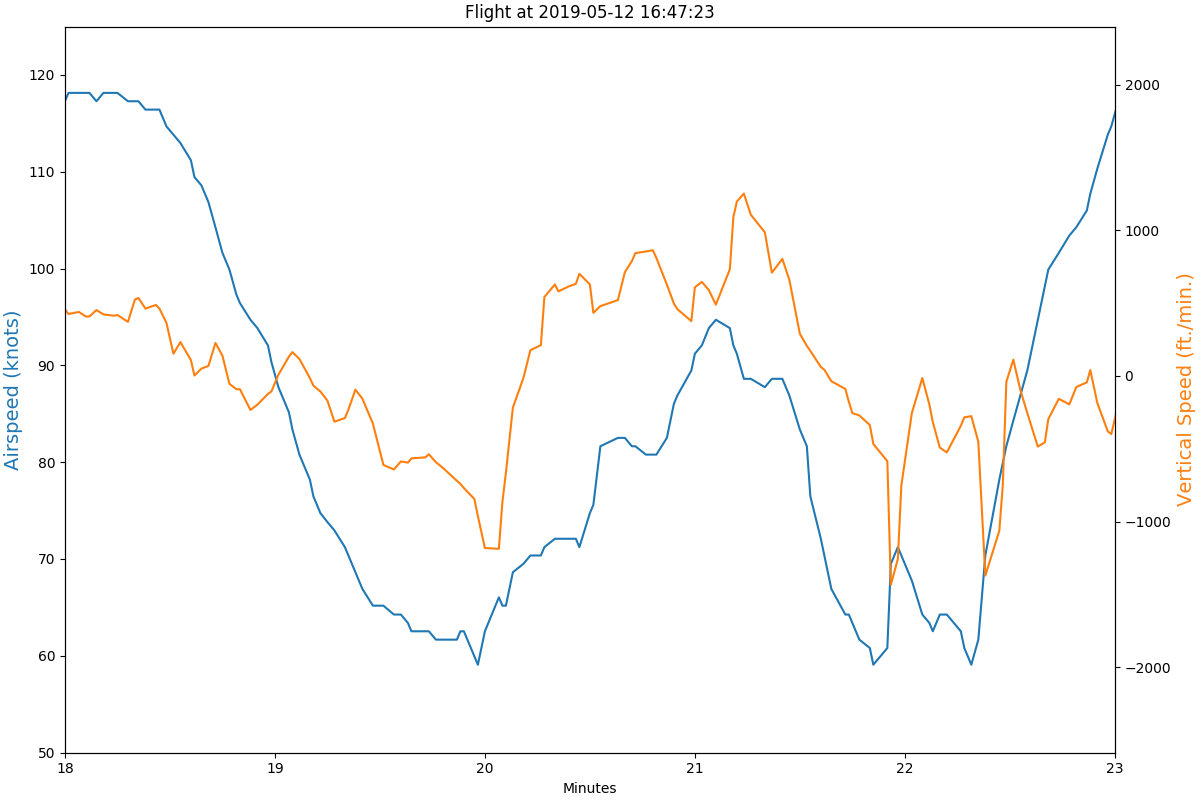
Two things immediately jump out. The first stall is slower, about 57 knots instead of the 60 that the previous graph showed. The second stall is actually two stalls, not one. The rolling average had smoothed that into one gradual curve.
My test revealed a stall speed, with flaps fully extended, of 57 knots, which is 66 MPH. That was much closer what I expect from my Bede BD-4C airplane.
Final Stall Tests at Light Weight
I went back up a couple of days later to more carefully measure stall speeds. These tests were done at fairly light weight, one person in the airplane and partial fuel, about 1650 pounds. Gross weight for my Bede BD-4C is 2400 pounds. Since stall speed increases with weight, I still have some additional tests to run.
Here are the results.
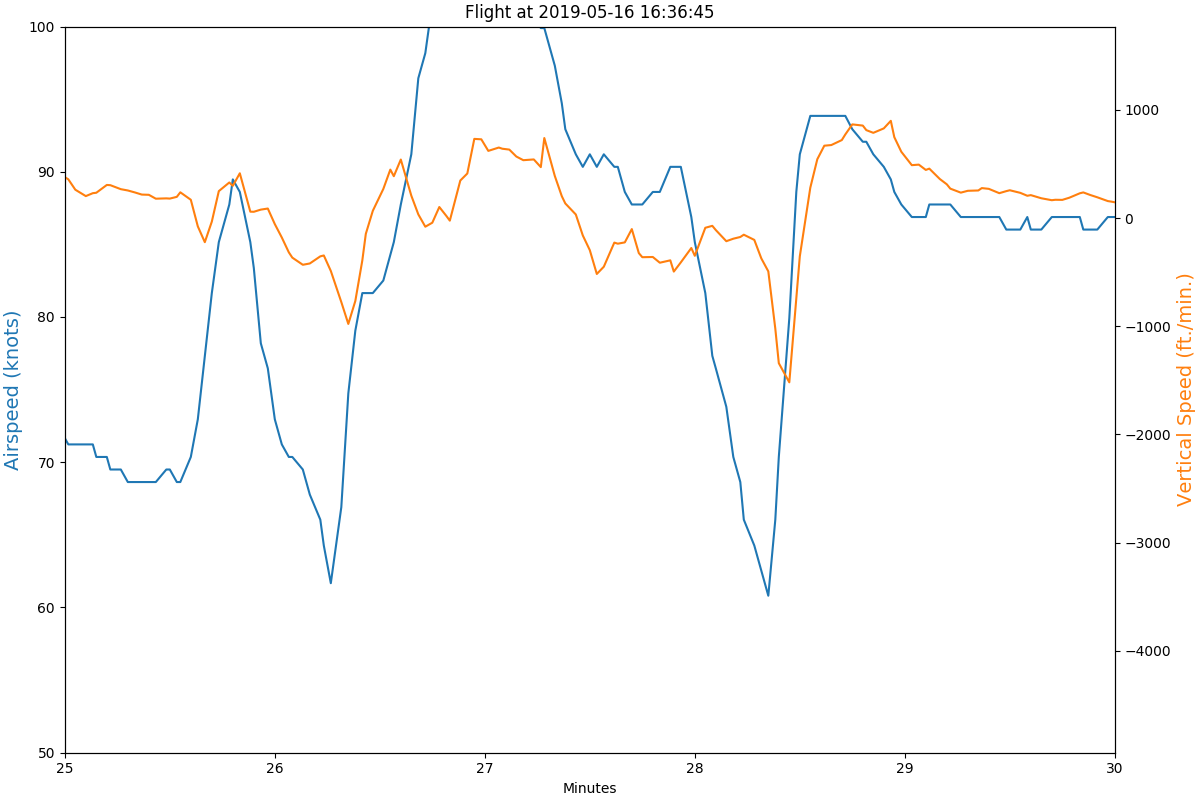

The actual numbers are:
- Flaps up stall: 61 knots / 70 MPH
- Flaps down stall: 55 knots / 63 MPH
With those numbers in mind, I have reduced the speed that I use for flying “short final,” the speed I am flying just as I cross the threshold of the runway on landing, from 75 knots to 60-65 knots. That lower speed means that I will use much less runway when landing, a very good thing.

i 100% appreciate the geeking out and real world results of this adventure!! 🙂
😀