Last Sunday, before the high water, I did a few quick performance and fuel flow tests in my Bede BD-4C airplane. I wanted to get a rough idea of “short field performance,” how little runway is required to take off and land. I also wanted to confirm the fuel flow rates at several typical engine power settings.
Takeoff and Landing Performance
Short field takeoff and landing performance means four things:
- How short a runway is required to take off?
- How short a runway is required to land?
- How much horizontal distance is required to take off and clear the top of a canonical tree, 50 feet tall?
- How much horizontal distance is required to land if the same canonical 50 foot tree is at the approach end of the runway?
Measuring those distances is surprisingly finicky because there are so many variables. All of these will significantly influence the distances:
- Wind speed; even 10 knots makes a big difference
- Altitude above sea level; high altitude means thinner air so the propeller and the wing generate less thrust and lift, respectively, and the engine generates less power
- Temperature and, to a lesser extent, humidity; higher temperature and humidity is the same as higher altitude
- Weight of the airplane with fuel and occupants
- Tire pressure
- Runway surface, grass or concrete
- Pilot’s technique
You get the idea. If I were fanatical about it, and wanted to get the absolute best possible number, I would even want an airplane with the fewest antennae sticking out into the breeze, and a nicely waxed paint job.
With all of that in mind, I decided to do a quick test just to get a ballpark idea of the first two numbers. The day that I had available was breezy, with about 12 knots of wind. I flew a couple of circuits, two takeoffs and two landings. On each takeoff, I got the engine up to full power at the very end of the runway before allowing the airplane to start moving, used two notches of flaps, and had my son, David, observe where the wheels left the ground. For the landings, I landed and stopped in as little distance as possible. My son observed both where the wheels touched down and where I stopped, so we could measure both the ground roll (amount of runway used) and the total distance from the runway threshold (which accounts for my inexperienced flying technique in the BD-4C and the distance I “floated” down the runway before the wheels finally touched).
After we put the airplane back in the hangar, David and I went back to the taxiway parallel to the runway and measured. This is what we came up with on a day with winds 11 knots, gusting 22, density altitude of approximately 500 feet, and airplane weight of approximately 1700 pounds (gross weight is 2400 pounds):
- short field takeoff: 723 ft
- short field landing: 792 ft
- normal landing: 1011 ft
Fuel Flow
As previously mentioned, I had incorrectly set the K-factor for my fuel flow sensor. After properly setting it to 18,000, I reran the fuel flow tests. I wanted to know the fuel consumption at several power settings:
- Takeoff power: “Pedal to the metal” with the mixture full rich. I use this when taking off and climbing to about 1000 feet AGL (above ground level).
- Cruise climb: This is 150 HP (75% of the engine’s rated power) but with the mixture full rich to reduce cylinder head temperature.
- Cruise at 75% power, 65%, and 55%.
Here is the overview graph.
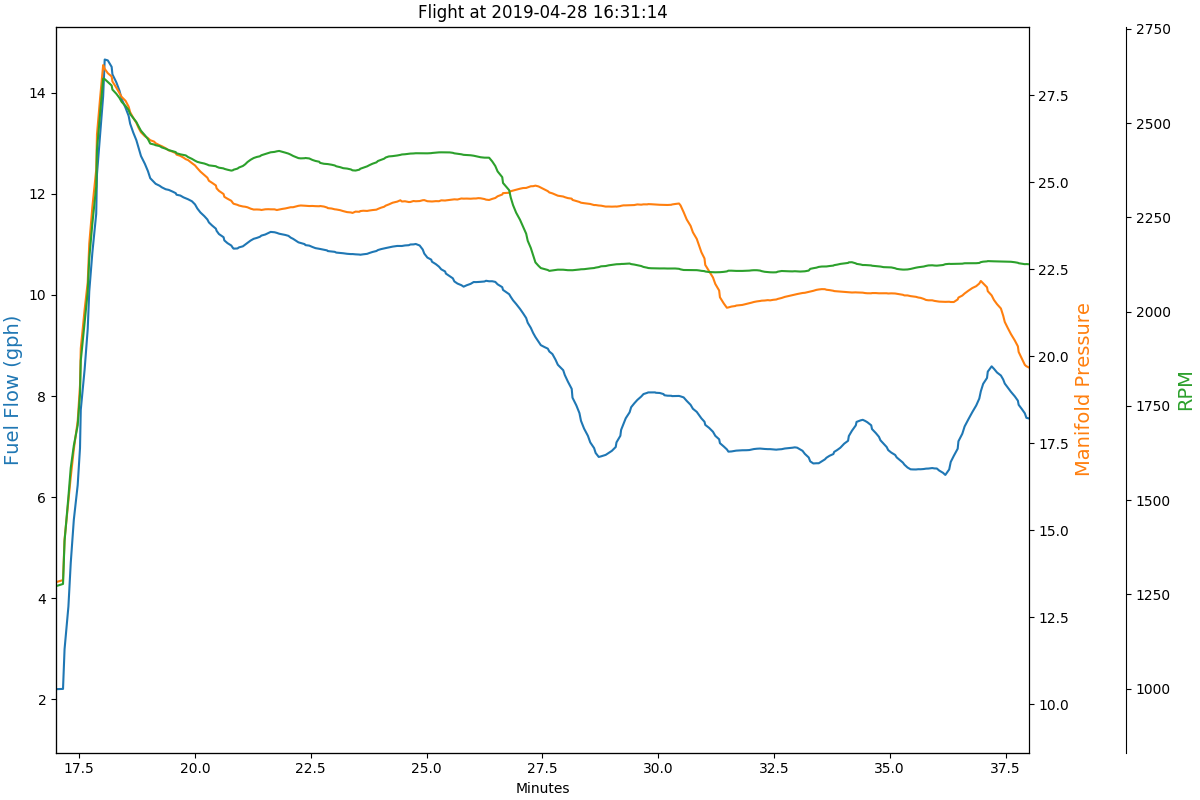
I extracted the actual numbers from the data to get my measurements. The graph is easier to read but I did not try to interpret the graph into numbers.
- fuel flow @ takeoff power 15.2 gph
- fuel flow @ cruise climb, 75%, full rich 11.8 gph
- fuel flow @ 75% 10.9 gph
- fuel flow @ 65% 8.00 gph
- fuel flow @ 55% 7.00 gph
These numbers are consistent with what other people achieve with 200 HP Lycoming IO-360 engines, so I am confident that my engine is doing what it should.
Leaning the Mixture
To determine fuel flow at 75% power, 65% power, and 55% power, I leaned the mixture (air to fuel ratio) to the best economy (lowest fuel flow). Lycoming’s engine user’s manual gives this procedure:
- 75% power or higher: Lean to peak exhaust gas temperature (EGT) and then enrichen the mixture until the EGT drops 150 degrees. This is called 150 degrees ROP (rich-of-peak).
- Less than 75% power: Lean to peak EGT and optionally lean until the EGT drops 50 degrees. This is called 50 degrees LOP (lean-of-peak).
The Lycoming manual actually says that you can also lean by simply observing when the engine begins to run rough. You may not observe a drop in RPM. Then enrichen until it runs smoothly and assume that this is peak EGT. The manual says that this is as accurate as using the EGT gauge in the airplane. I tried that technique and then analyzed the data on the ground and found that that simple method worked great.
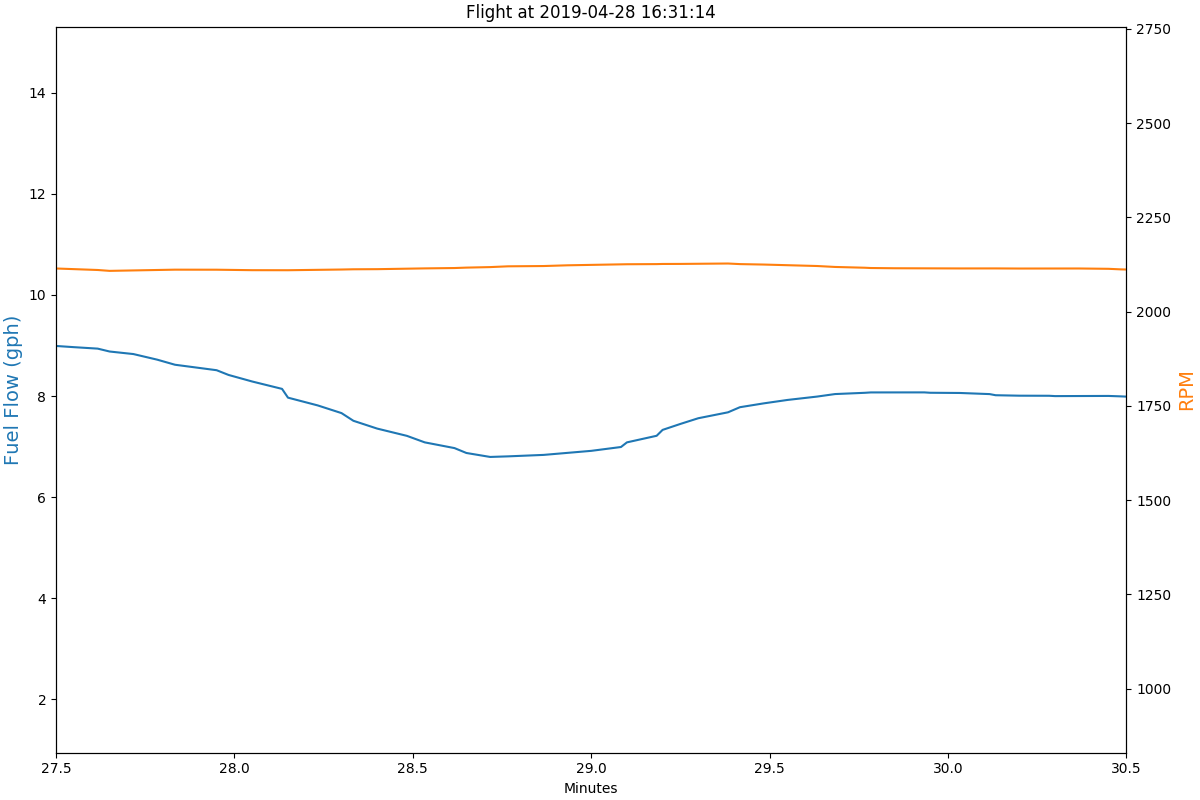
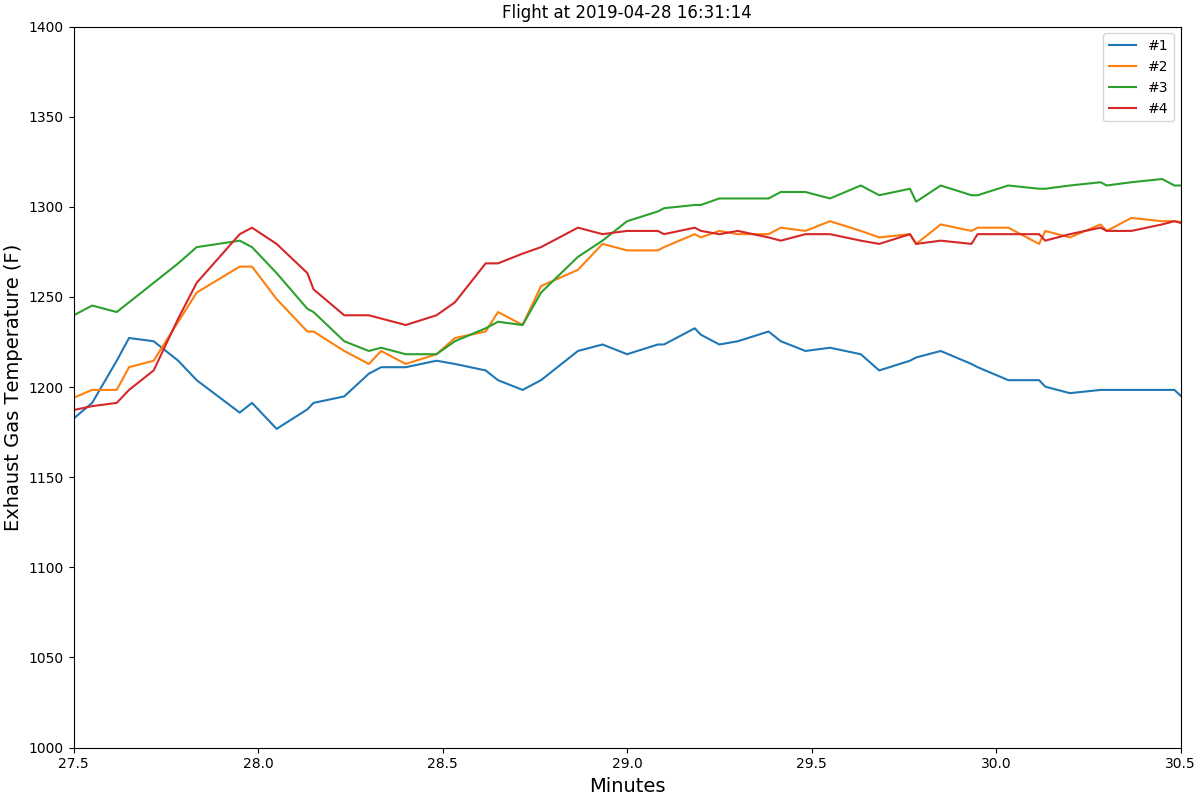
Here are zoomed in graphs for 65% power. You can see the EGT as I was leaning the mixture.
Next Steps
Now that I have the autopilot and fuel flow meter working properly, and I have confirmed that the airspeed indicator is accurate, I will go back and carefully measure airspeed at 75% power, 65% power, and 55% power. Once I have those numbers, I will be able to calculate my fuel economy (miles per gallon) and maximum range (miles) and endurance (hours).
Using the autopilot, I will also finish up the best rate of climb measurements.

David is brave, being on the runway to measure while you are taking off and landing!! WOW
Were David out on the runway during a takeoff or landing, I think that we would have to spell “brave” s-t-u-p-i-d. 😀 He was on the taxiway, which is parallel to the runway, while I was taking off and landing.
Has David been a passenger with you yet?
No passengers, yet, Bob. I need 10.9 more hours of flight testing before I can carry passengers.